
Question 1
Useful Data has been mentioned above.
This data attachment is just for a reference & not for an evaluation.

The IIT Madras BS Statistics for Data Science I (Stats 1) End Term paper sat on 10 May 2026, in the January 2026 term: 16 questions for 42 marks in 180 minutes. Every question is below with its answer. Take it as a timed mock test to be marked, or read it through first.
Useful Data has been mentioned above.
This data attachment is just for a reference & not for an evaluation.
Correct answer
Useful Data has been mentioned above.
Match the data types listed in Column A with the corresponding category in Column B, as shown in Table 1.
(P)-(3), (Q)-(4), (R)-(2), (S)-(1)
(P)-(4), (Q)-(3), (R)-(2), (S)-(1)
(P)-(3), (Q)-(4), (R)-(1), (S)-(2)
(P)-(1), (Q)-(2), (R)-(3), (S)-(4)
Correct answer
(P)-(3), (Q)-(4), (R)-(2), (S)-(1)
At a school function, it is noticed that 9% of the students are not wearing polished shoes and 14% are not wearing school ties. These two violations are independent. If a teacher selects 5 students at random, what is the probability that exactly three of them will be punished for at least one violation?
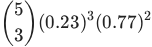
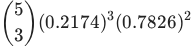

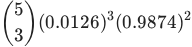
Correct answer
The waiting time for a bus at a certain stop is exponentially distributed with a mean waiting time of 12 minutes. If there is a 75% chance that a passenger will wait at most minutes, then what is the value of ?
—


—
Correct answer
—
Let , find the value of in terms of such that .
—
—
—
—
Correct answer
—
Rohit wants to open his door with 5 keys(out of which 1 will open the door) and tries the keys independently and at random. If unsuccessful keys are eliminated from further selection, then find the expected number of trials required to open the door.
A written answer, not marked automatically.
The number of system failures in a data center follows a Poisson distribution with an average rate of 1.2 failures per day. What is the probability that there will be no system failures during a specific 12-hour shift? Enter the answer correct to two decimal places.
A written answer, not marked automatically.
The time students spend studying and their scores on an exam are shown in Table 2.
Which of the following option(s) is/are correct?
There is a strong positive correlation between Study Hours and Exam Score.
Study hours and Exam Score have a weak correlation.
The data show that students who study less tend to score higher on the exam.
The Pearson correlation coefficient ( ) for this data set is .
Correct answers
There is a strong positive correlation between Study Hours and Exam Score.
The Pearson correlation coefficient ( ) for this data set is .
Let and be two random variables. Choose all the correct statements from the following:
.
—
The variance of a Bernoulli random variable is maximum when , where is the probability of success.
= + for any two random variables and .
Correct answers
—
The variance of a Bernoulli random variable is maximum when , where is the probability of success.
The number of students who use different modes of transport to get to school is shown in Figure 1.
Find the relative frequency of students going on a cycle. Enter the answer correct to one decimal place.
A written answer, not marked automatically.
A company has two departments. The Sales department has 30 employees with an average monthly salary of Rs. 50,000, while the Marketing department has 20 employees with an average monthly salary of Rs. 60,000. If the company considers both departments together, what is the overall average monthly salary of all employees?
A written answer, not marked automatically.
How many three digit numbers are there that do not contain ?
A written answer, not marked automatically.
In a program, every student belongs to exactly one of three levels: Foundation, Diploma, or Degree. A student is chosen at random from the program. The probability that the chosen student is at the Foundation or Diploma level is 0.8.• The probability that the chosen student is at the Diploma or Degree level is 0.6. Find the probability that the chosen student is at the Diploma level. Enter the answer correct to one decimal place. •
A written answer, not marked automatically.
The cumulative distribution function (CDF) of the number of customers ( ) waiting in a queue at a specific time is given as follows:
Based on the above data, answer the given subquestions.
Find the probability that there are exactly 2 customers in the queue. Enter the answer correct to two decimal places.
A written answer, not marked automatically.
The cumulative distribution function (CDF) of the number of customers ( ) waiting in a queue at a specific time is given as follows:
Based on the above data, answer the given subquestions.
Find the probability that there are at least 1 customer in the queue. Enter the answer correct to two decimal places.
A written answer, not marked automatically.
The cumulative distribution function (CDF) of the number of customers ( ) waiting in a queue at a specific time is given as follows:
Based on the above data, answer the given subquestions.
A written answer, not marked automatically.