Quiz Space

May 2023 term · Statistics for Data Science II · BSMA1004

Stats 2 Quiz 1: 16 July 2023, Set 2 (May 2023 term)

The IIT Madras BS Statistics for Data Science II (Stats 2) Quiz 1 paper sat on 16 Jul 2023, in the May 2023 term, set 2: 24 questions for 48 marks in 120 minutes. Every question is below with its answer. Take it as a timed mock test to be marked, or read it through first.

Questions
24
Marks
48
Duration
120 min
MCQ
9
Written
14
MSQ
1

Updated

Official paper: IIT M DEGREE AN3 EXAM QPE3 16 JULY 2023 · No negative marking.

Question 1

+1 markOne correct option

THIS IS QUESTION PAPER FOR THE SUBJECT "FOUNDATION LEVEL : SEMESTER 2: STATISTICS FOR DATA SCIENCE II (COMPUTER BASED EXAM) " ARE YOU SURE YOU HAVE TO WRITE EXAM FOR THIS SUBJECT? CROSS CHECK YOUR HALL TICKET TO CONFIRM THE SUBJECTS TO BE WRITTEN. (IF IT IS NOT THE CORRECT SUBJECT, PLS CHECK THE SECTION AT THE TOP FOR THE SUBJECTS REGISTERED BY YOU)

  1. A

    YES

  2. B

    NO

Show answer

Correct answer

  • A

    YES

Question 2

+1 markOne correct option
Figure from the original question paper
  1. A

    Useful Data has been mentioned above.

  2. B

    This data attachment is just for a reference & not for an evaluation.

Show answer

Correct answer

  • A

    Useful Data has been mentioned above.

Question 3

+3 marksOne correct option
Figure from the original question paper
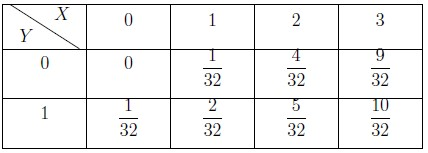
  1. A
    Figure from the original question paper
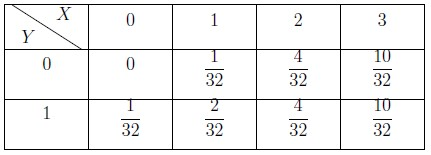
  2. B
    Figure from the original question paper
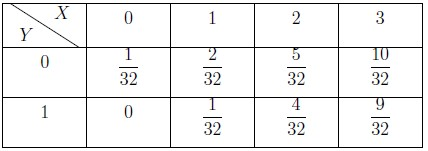
  3. C
    Figure from the original question paper
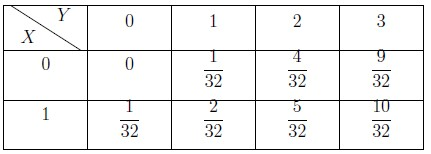
  4. D
    Figure from the original question paper
Show answer

Correct answer

  • C
    Figure from the original question paper

Question 4

+3 marksOne correct option
Figure from the original question paper
  1. A
    Figure from the original question paper
  2. B
    Figure from the original question paper
  3. C
    Figure from the original question paper
  4. D
    Figure from the original question paper
Show answer

Correct answer

  • A
    Figure from the original question paper

Question 5

+1 markOne correct option

Based on the above data, answer the given subquestions.

Based on the above data, answer the given subquestions.
Figure from the original question paper
  1. A
    Figure from the original question paper
  2. B
    Figure from the original question paper
  3. C
    Figure from the original question paper
  4. D
    Figure from the original question paper
Show answer

Correct answer

  • D
    Figure from the original question paper

Question 6

+2 marksOne correct option

Based on the above data, answer the given subquestions.

Based on the above data, answer the given subquestions.
Figure from the original question paper
  1. A
    Figure from the original question paper
  2. B
    Figure from the original question paper
  3. C
    Figure from the original question paper
  4. D
    Figure from the original question paper
Show answer

Correct answer

  • C
    Figure from the original question paper

Question 7

+3 marksWritten answer
Figure from the original question paper
Show answer

A written answer, not marked automatically.

Question 8

+3 marksWritten answer
Figure from the original question paper
Show answer

A written answer, not marked automatically.

Question 9

+3 marksOne correct option

Based on the above data, answer the given subquestions.

Based on the above data, answer the given subquestions.
Figure from the original question paper
  1. A
    Figure from the original question paper
  2. B
    Figure from the original question paper
  3. C
    Figure from the original question paper
  4. D
    Figure from the original question paper
Show answer

Correct answer

  • A
    Figure from the original question paper

Question 10

+2 marksWritten answer

Based on the above data, answer the given subquestions.

Based on the above data, answer the given subquestions.
Figure from the original question paper
Show answer

A written answer, not marked automatically.

Question 11

+2 marksOne correct option

Ten students from classes 9 and 10 have been nominated to form the school committee. The table below provides the number of boys and girls selected from each class:

Ten students from classes 9 and 10 have been nominated to form the school committee. The table below provides the number of boys and girls selected from each class: The committee will consist of four students, with two students selected from each class uniformly at random. Based on the above data, answer the given subquestions.

Ten students from classes 9 and 10 have been nominated to form the school committee.  The table below provides the numbe

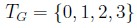
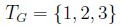
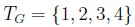
Let a random variable G represent the number of girls selected for the committee. Find the range of G.

  1. A
    Figure from the original question paper
  2. B
    Figure from the original question paper
  3. C
    Figure from the original question paper
  4. D
    Figure from the original question paper
Show answer

Correct answer

  • B
    Figure from the original question paper

Question 12

+3 marksWritten answer

Ten students from classes 9 and 10 have been nominated to form the school committee. The table below provides the number of boys and girls selected from each class:

Ten students from classes 9 and 10 have been nominated to form the school committee. The table below provides the number of boys and girls selected from each class: The committee will consist of four students, with two students selected from each class uniformly at random. Based on the above data, answer the given subquestions.

Ten students from classes 9 and 10 have been nominated to form the school committee.  The table below provides the numbe

Find the expected number of girls selected for the committee. Enter the answer correct to two decimal places.

Show answer

A written answer, not marked automatically.

Question 13

+3 marksOne or more correct options

Based on the above data, answer the given subquestions.

Based on the above data, answer the given subquestions.
Figure from the original question paper

Select all that apply.

  1. A
    Figure from the original question paper
  2. B
    Figure from the original question paper
  3. C
    Figure from the original question paper
  4. D
    Figure from the original question paper
Show answer

Correct answers

  • B
    Figure from the original question paper
  • D
    Figure from the original question paper

Question 14

+2 marksWritten answer

Based on the above data, answer the given subquestions.

Based on the above data, answer the given subquestions.
Figure from the original question paper
Show answer

A written answer, not marked automatically.

Question 15

+3 marksOne correct option

Based on the above data, answer the given subquestions.

Based on the above data, answer the given subquestions.
Figure from the original question paper
  1. A

    90

  2. B

    92

  3. C

    30

  4. D

    32

Show answer

Correct answer

  • B

    92

Question 16

+2 marksWritten answer

Based on the above data, answer the given subquestions.

Based on the above data, answer the given subquestions.
Figure from the original question paper
Show answer

A written answer, not marked automatically.

Question 17

+2 marksWritten answer

Based on the above data, answer the given subquestions.

Based on the above data, answer the given subquestions.

Find the value of k.

Show answer

A written answer, not marked automatically.

Question 18

+3 marksWritten answer

Based on the above data, answer the given subquestions.

Based on the above data, answer the given subquestions.
Figure from the original question paper
Show answer

A written answer, not marked automatically.

Question 19

+1 markWritten answer

Based on the above data, answer the given subquestions.

Based on the above data, answer the given subquestions.
Show answer

A written answer, not marked automatically.

Question 20

+1 markWritten answer

Based on the above data, answer the given subquestions.

Based on the above data, answer the given subquestions.
Show answer

A written answer, not marked automatically.

Question 21

+1 markWritten answer

Ten students from classes 9 and 10 have been nominated to form the school committee. The table below provides the number of boys and girls selected from each class:

Ten students from classes 9 and 10 have been nominated to form the school committee. The table below provides the number of boys and girls selected from each class: The committee will consist of four students, with two students selected from each class uniformly at random. Based on the above data, answer the given subquestions.

Ten students from classes 9 and 10 have been nominated to form the school committee.  The table below provides the numbe
Show answer

A written answer, not marked automatically.

Question 22

+1 markWritten answer

Based on the above data, answer the given subquestions.

Based on the above data, answer the given subquestions.
Show answer

A written answer, not marked automatically.

Question 23

+1 markWritten answer

Based on the above data, answer the given subquestions.

Based on the above data, answer the given subquestions.
Show answer

A written answer, not marked automatically.

Question 24

+1 markWritten answer

Based on the above data, answer the given subquestions.

Based on the above data, answer the given subquestions.
Show answer

A written answer, not marked automatically.