
Question 1
Useful Data has been mentioned above.
This data attachment is just for a reference & not for an evaluation.

The IIT Madras BS Statistics for Data Science II (Stats 2) Quiz 2 paper sat on 16 Aug 2026, in the May 2026 term: 26 questions for 47 marks in 120 minutes. Every question is below with its answer. Take it as a timed mock test to be marked, or read it through first.
Useful Data has been mentioned above.
This data attachment is just for a reference & not for an evaluation.
Correct answer
Useful Data has been mentioned above.
Let are three independent and identically distributed random variables with mean and variance . Given below are 3 different formulations. Which of the following option(s) is/are correct?
—
—
—
—
Correct answers
—
—
—
Let . Define a random variable as
Find the CDF of .
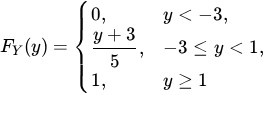
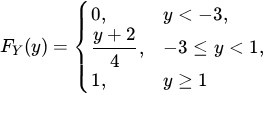
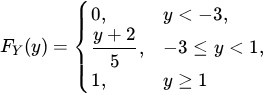
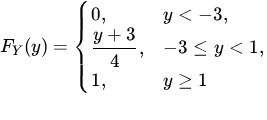
Correct answer
Let , where . Find the value of . Enter the answer correct to three decimal places.
A written answer, not marked automatically.
Let and be discrete random variables with the joint probability mass function,
Find the value of . Enter the answer correct to two decimal places.
A written answer, not marked automatically.
A factory produces light bulbs. The lifetime of an individual bulb has a mean of 1200 hours and a standard deviation of 180 hours. By using Central limit theorem, a quality engineer computes the probability that the average lifetime of a random sample of bulbs is greater than 1230 hours to be approximately 0.07. What is the minimum sample size taken by the engineer ? Solution: Let represents lifetime of an individual bulb with mean =1200 and standard deviation =180. Let be the average lifetime of samples. Therefore, and are and respectively. We are given that, By using CLT, On comparing with Z-values, Consider the following options for the blanks.
Answer the given sub-questions. Note: Enter only the correct option number (e.g. 8) without any brackets or punctuation.
Enter the correct option number for .
A written answer, not marked automatically.
A factory produces light bulbs. The lifetime of an individual bulb has a mean of 1200 hours and a standard deviation of 180 hours. By using Central limit theorem, a quality engineer computes the probability that the average lifetime of a random sample of bulbs is greater than 1230 hours to be approximately 0.07. What is the minimum sample size taken by the engineer ? Solution: Let represents lifetime of an individual bulb with mean =1200 and standard deviation =180. Let be the average lifetime of samples. Therefore, and are and respectively. We are given that, By using CLT, On comparing with Z-values, Consider the following options for the blanks.
Answer the given sub-questions. Note: Enter only the correct option number (e.g. 8) without any brackets or punctuation.
Enter the correct option number for .
A written answer, not marked automatically.
A factory produces light bulbs. The lifetime of an individual bulb has a mean of 1200 hours and a standard deviation of 180 hours. By using Central limit theorem, a quality engineer computes the probability that the average lifetime of a random sample of bulbs is greater than 1230 hours to be approximately 0.07. What is the minimum sample size taken by the engineer ? Solution: Let represents lifetime of an individual bulb with mean =1200 and standard deviation =180. Let be the average lifetime of samples. Therefore, and are and respectively. We are given that, By using CLT, On comparing with Z-values, Consider the following options for the blanks.
Answer the given sub-questions. Note: Enter only the correct option number (e.g. 8) without any brackets or punctuation.
Enter the correct option number for .
A written answer, not marked automatically.
A factory produces light bulbs. The lifetime of an individual bulb has a mean of 1200 hours and a standard deviation of 180 hours. By using Central limit theorem, a quality engineer computes the probability that the average lifetime of a random sample of bulbs is greater than 1230 hours to be approximately 0.07. What is the minimum sample size taken by the engineer ? Solution: Let represents lifetime of an individual bulb with mean =1200 and standard deviation =180. Let be the average lifetime of samples. Therefore, and are and respectively. We are given that, By using CLT, On comparing with Z-values, Consider the following options for the blanks.
Answer the given sub-questions. Note: Enter only the correct option number (e.g. 8) without any brackets or punctuation.
Enter the correct option number for .
A written answer, not marked automatically.
A factory produces light bulbs. The lifetime of an individual bulb has a mean of 1200 hours and a standard deviation of 180 hours. By using Central limit theorem, a quality engineer computes the probability that the average lifetime of a random sample of bulbs is greater than 1230 hours to be approximately 0.07. What is the minimum sample size taken by the engineer ? Solution: Let represents lifetime of an individual bulb with mean =1200 and standard deviation =180. Let be the average lifetime of samples. Therefore, and are and respectively. We are given that, By using CLT, On comparing with Z-values, Consider the following options for the blanks.
Answer the given sub-questions. Note: Enter only the correct option number (e.g. 8) without any brackets or punctuation.
Calculate the value for .
A written answer, not marked automatically.
Let , where . Based on the above data, answer the given subquestions.
Which of the following option(s) is/are correct?
Uniform[1,4]
Uniform[4,7]


Correct answers
Uniform[1,4]
Let , where . Based on the above data, answer the given subquestions.
What is the value of ? Enter the answer correct to one decimal place.
A written answer, not marked automatically.
Let . Suppose that and Based on the above data, answer the given subquestions.
What is the marginal density of ?
—
—
—
—
Correct answer
—
Let . Suppose that and Based on the above data, answer the given subquestions.
Find Enter the answer correct to two decimal places.
A written answer, not marked automatically.
Let
. Define a centralised random variable where . Based on the above data, answer the given subquestions.
Find the moment generating function (MGF) of , where
.
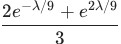
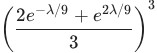
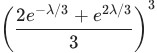
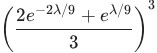
Correct answer
Let
. Define a centralised random variable where . Based on the above data, answer the given subquestions.
Inscript Find the value of , where
. Enter the answer correct to two decimal places.
A written answer, not marked automatically.
Let be i.i.d random variables with mean 10 and variance 25. Based on the above data, answer the given subquestions.
Find the value of
.
A written answer, not marked automatically.
Let be i.i.d random variables with mean 10 and variance 25. Based on the above data, answer the given subquestions.
Find the value of Var , where
. Enter the answer correct to three decimal places.
A written answer, not marked automatically.
Let represent the amount of rainfall (in cm) received on a particular day in a city. The PDF of is
Based on the above data, answer the given subquestions.
What is the probability that the rainfall on a day is between 2 cm and 4 cm? Enter the answer correct to two decimal places.
A written answer, not marked automatically.
Let represent the amount of rainfall (in cm) received on a particular day in a city. The PDF of is
Based on the above data, answer the given subquestions.
Find the value of expected daily rainfall. Enter the answer correct to two decimal places.
A written answer, not marked automatically.
A factory produces light bulbs. The lifetime of an individual bulb has a mean of 1200 hours and a standard deviation of 180 hours. By using Central limit theorem, a quality engineer computes the probability that the average lifetime of a random sample of bulbs is greater than 1230 hours to be approximately 0.07. What is the minimum sample size taken by the engineer ? Solution: Let represents lifetime of an individual bulb with mean =1200 and standard deviation =180. Let be the average lifetime of samples. Therefore, and are and respectively. We are given that, By using CLT, On comparing with Z-values, Consider the following options for the blanks.
Answer the given sub-questions. Note: Enter only the correct option number (e.g. 8) without any brackets or punctuation.
A written answer, not marked automatically.
Let , where . Based on the above data, answer the given subquestions.
A written answer, not marked automatically.
Let . Suppose that and Based on the above data, answer the given subquestions.
A written answer, not marked automatically.
Let
. Define a centralised random variable where . Based on the above data, answer the given subquestions.
A written answer, not marked automatically.
Let be i.i.d random variables with mean 10 and variance 25. Based on the above data, answer the given subquestions.
A written answer, not marked automatically.
Let represent the amount of rainfall (in cm) received on a particular day in a city. The PDF of is
Based on the above data, answer the given subquestions.
A written answer, not marked automatically.